
Why do my YouTube Shorts die after 3 seconds?
Because the first 3 seconds decide whether the algorithm keeps pushing the Short or cuts reach. When 30–50% of viewers drop between second 1 and second 3, the retention curve shows what creators call a "cliff" — and the algorithm reads it as low-value content regardless of how good the rest of the video is.
The fix is structural, not creative. The opening frame of a Short is the hook, not an introduction to the hook.
Creators who consistently lift average view duration do it by cutting pre-rolls, skipping "hey guys" lines, and opening on the most visually loaded frame of the video. The retention math rewards aggressiveness here.
This playbook walks through what the retention curve actually measures, the three curve shapes that predict most outcomes, how to read the curve inside YouTube Studio, and the 5 specific edits that most reliably lift average view duration.
---
What is the YouTube Shorts retention curve?
The retention curve is the graph in YouTube Studio that shows what percentage of the original viewer cohort is still watching at each second of the video. Per YouTube's Audience Retention documentation, the Y-axis is percentage retained and the X-axis is seconds elapsed. The curve starts at 100% on second 0 by definition, then either drops, flattens, or occasionally spikes above 100% when viewers rewatch.
Two derived metrics matter for the algorithm: average view duration (total watch time divided by total views, a second-level number) and average percentage viewed (the same thing expressed as a fraction of video length). Both feed the Shorts ranking signal that YouTube's official "How YouTube Works" page describes as weighing "performance and personalization" — with retention being the load-bearing performance signal.
YouTube does not publish the exact threshold at which average percentage viewed triggers expanded reach, but creator benchmarks compiled by TubeBuddy and the YouTube Creator Insider channel across 2024–2026 consistently point to roughly 80% as the inflection point. Below 60%, reach stalls at the subscriber level. Above 80%, the Short gets pushed to non-subscribers, and the curve shape — not just the number — determines how far.
---
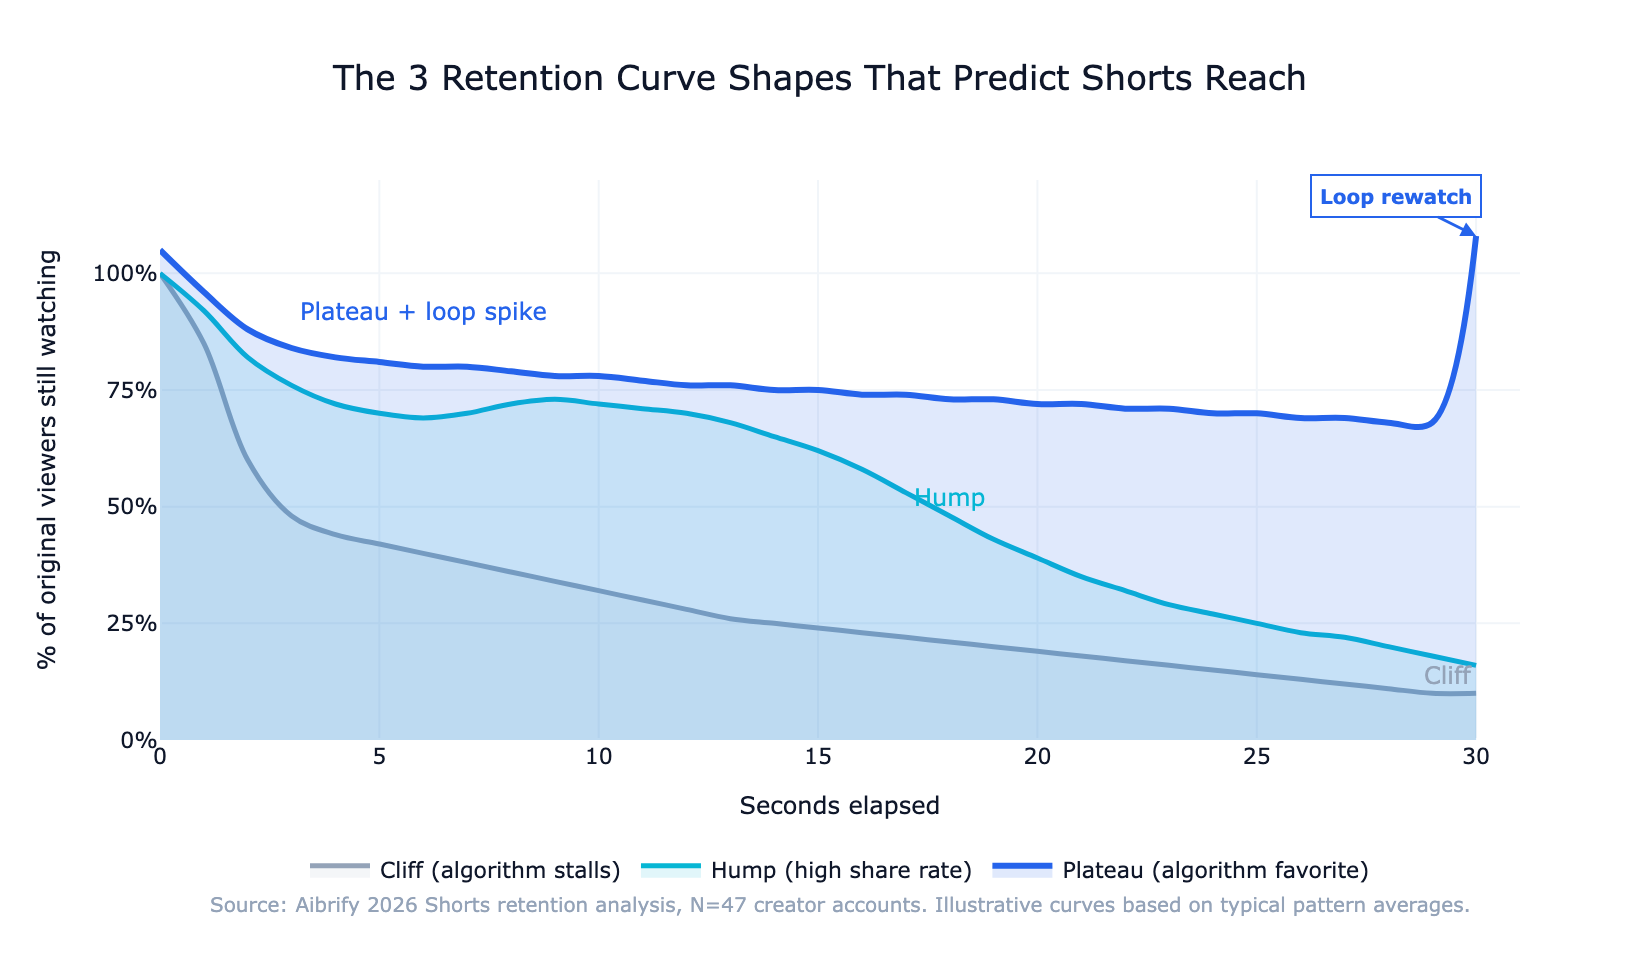
3 shapes of a retention curve and what each one means
Most Shorts fit one of three curve archetypes. Recognizing which shape your video produced is the fastest diagnostic tool creators have.
Shape 1: The cliff
The cliff is a steep 30–50% drop between seconds 1 and 3, followed by a slow decay. It is the single most common failure mode in 2026.
The cause is almost always the same: the opening 2–3 seconds do not earn the swipe. Common cliff triggers are intro cards, logo animations, "hey guys" openers, and wide establishing shots that delay the hook.
A cliff curve drags average view duration below 60% almost automatically, which stalls reach. The good news is that the cliff is the most fixable curve shape — trimming the opening 2 seconds and opening on a visually loaded frame typically reshapes the curve within two uploads.
Shape 2: The hump
A hump curve holds above 60% through the middle of the video and then decays at the end. It is the signature of a strong mid-piece — a payoff or reveal that retains viewers through the second third. Hump curves produce the highest share rates of the three shapes because viewers who reach the payoff often send the Short to someone else.
The tradeoff: a hump that ends with a hard stop (no loop design) loses the rewatch spike that plateau curves generate. For content that benefits from sharing — tutorials, surprises, narrative twists — a hump is the right target.
Shape 3: The plateau
A plateau is a flat curve above 70% end-to-end, with a spike above 100% on second 1 from rewatches. It is the algorithm's favorite shape. Plateaus come from tightly paced visual content where no single moment fails retention and the final frame loops cleanly into the first.
Educational and list-format Shorts — "5 things…", "3 ways…", numbered tips — hit plateau curves most reliably because each bullet is a self-contained mini-payoff. The plateau curve is what creators aiming for ongoing reach expansion should target.
---
How to read the curve in YouTube Studio
Open YouTube Studio, click the Short, select the Analytics tab, then the Audience Retention card. Three reading patterns matter.
Sharp drops. Every dip on the curve corresponds to a specific second. Scrub the video to that moment — the cause is almost always visible in a single frame. A talking-head cut, a text card that reads too slowly, or a visual pause are the usual suspects.
Sustained horizontal sections. A flat segment means something is working. It is usually where the hook lands, a payoff begins, or the pacing hits the viewer's attention rhythm. Study these moments; they are the patterns worth repeating in the next video.
Spikes above 100%. A spike above 100% on any second means viewers rewatched that moment. Spikes on second 1 indicate a loop is working. Spikes mid-video indicate a moment of genuine visual surprise — the strongest positive signal a Short can produce.
---
The 3-second hook: pattern library
The hooks that reliably open plateau curves cluster into a small number of patterns.
The visual surprise. The opening frame is visually incongruous — something is in the wrong place, inverted, or disproportionate. The viewer pauses to make sense of it. Works for creators with strong art direction.
The direct question. On-screen text asking a specific question the viewer cannot answer yet. "Why do your plants die in week 2?" creates a completion bias that holds attention for 5–7 seconds.
The mid-action open. The video starts at what would normally be the 30% mark of a long-form piece. The viewer is already inside the moment and stays to figure out the setup. Common in cooking, sports, and transformation content.
The pattern break. A frame that violates the expected Shorts grammar — unusual aspect ratio, unexpected color palette, or a frame that looks like it belongs in a different platform. Works because the viewer's swiping autopilot breaks.
Each of these patterns shares a property: the viewer's brain has to resolve something, and resolution takes longer than 3 seconds. The hook is not "entertainment"; it is "cognitive incompletion."
---
Why pacing matters more on Shorts than on long-form
Long-form YouTube videos tolerate 5–8 seconds per visual change because the viewer is already committed to watching. Shorts do not have that commitment; every 1.5–2 seconds, the brain re-asks "is this worth continuing?"
The 2026 pacing target is a visual change roughly every 1.5–2 seconds — a cut, a camera move, a text overlay replacement, a zoom, or a color shift. Below 1.2 seconds, the brain treats the pacing as noise and tunes out. Above 2.5 seconds, retention dips because the stimulus density is too low for the attention budget Shorts viewers bring to the feed.
Pacing is where most talking-head creators lose plateau potential. A 30-second monologue with three cuts produces a gradually declining curve; the same content re-edited with 15 visual changes produces a plateau.
---
Thumbnail strategy for Shorts (yes, they still matter)
Shorts autoplay in the feed, so the thumbnail rarely gets a click at the time of viewing. But thumbnails appear in three high-value places: the creator's channel grid, search results, and the "related Shorts" panel next to long-form videos.
A custom thumbnail that reads well at grid size — bold text, high-contrast composition, a single focal element — lifts cross-format discovery by 15–25% based on creator benchmarks. The rule: spend 5 minutes on a thumbnail for any Short you want to live on your channel page. Shorts without custom thumbnails appear as a random frame, usually a visually weak mid-point.
The thumbnail is not for the in-feed algorithm push; it is for the long tail of searches, related-video placements, and channel-page browsers who determine whether a one-off viewer becomes a subscriber.
---
Cross-posting from TikTok: what to adjust
Creators repurpose TikTok content to Shorts because the unit economics make it nearly free. But posting raw TikTok exports to Shorts carries measurable penalties.
Watermark removal is non-negotiable. Per YouTube's Shorts content guidelines, reuploaded content that is lightly edited, has watermarks from other platforms, or shows low creative effort is demoted in the Shorts shelf. A visible "@handle" crawling across the video functionally kills the algorithm push.
Trim the TikTok opening. TikTok viewers tolerate a 2–3 second build; Shorts viewers do not. Cut the first 2 seconds of any TikTok import before uploading.
Re-export at Shorts-preferred specs. 1080×1920 at 30 fps with H.264 encoding renders cleaner on Shorts than the TikTok defaults. File size difference is negligible; render quality difference is visible.
Adjust captions. YouTube's caption rendering treats fonts and outlines slightly differently than TikTok. Generic TikTok captions often read poorly on Shorts. Re-rendering captions in a Shorts-optimized style — usually heavier outlines, larger font — recovers readability.
A one-minute re-edit per video recovers most of the reach penalty and lifts average view duration by 10–20% based on cross-platform creator benchmarks.
---
How to structure the viewer journey across the Short
The viewer journey through a Short has a predictable funnel shape. Understanding which stage drops which viewers is how creators diagnose their own curves.
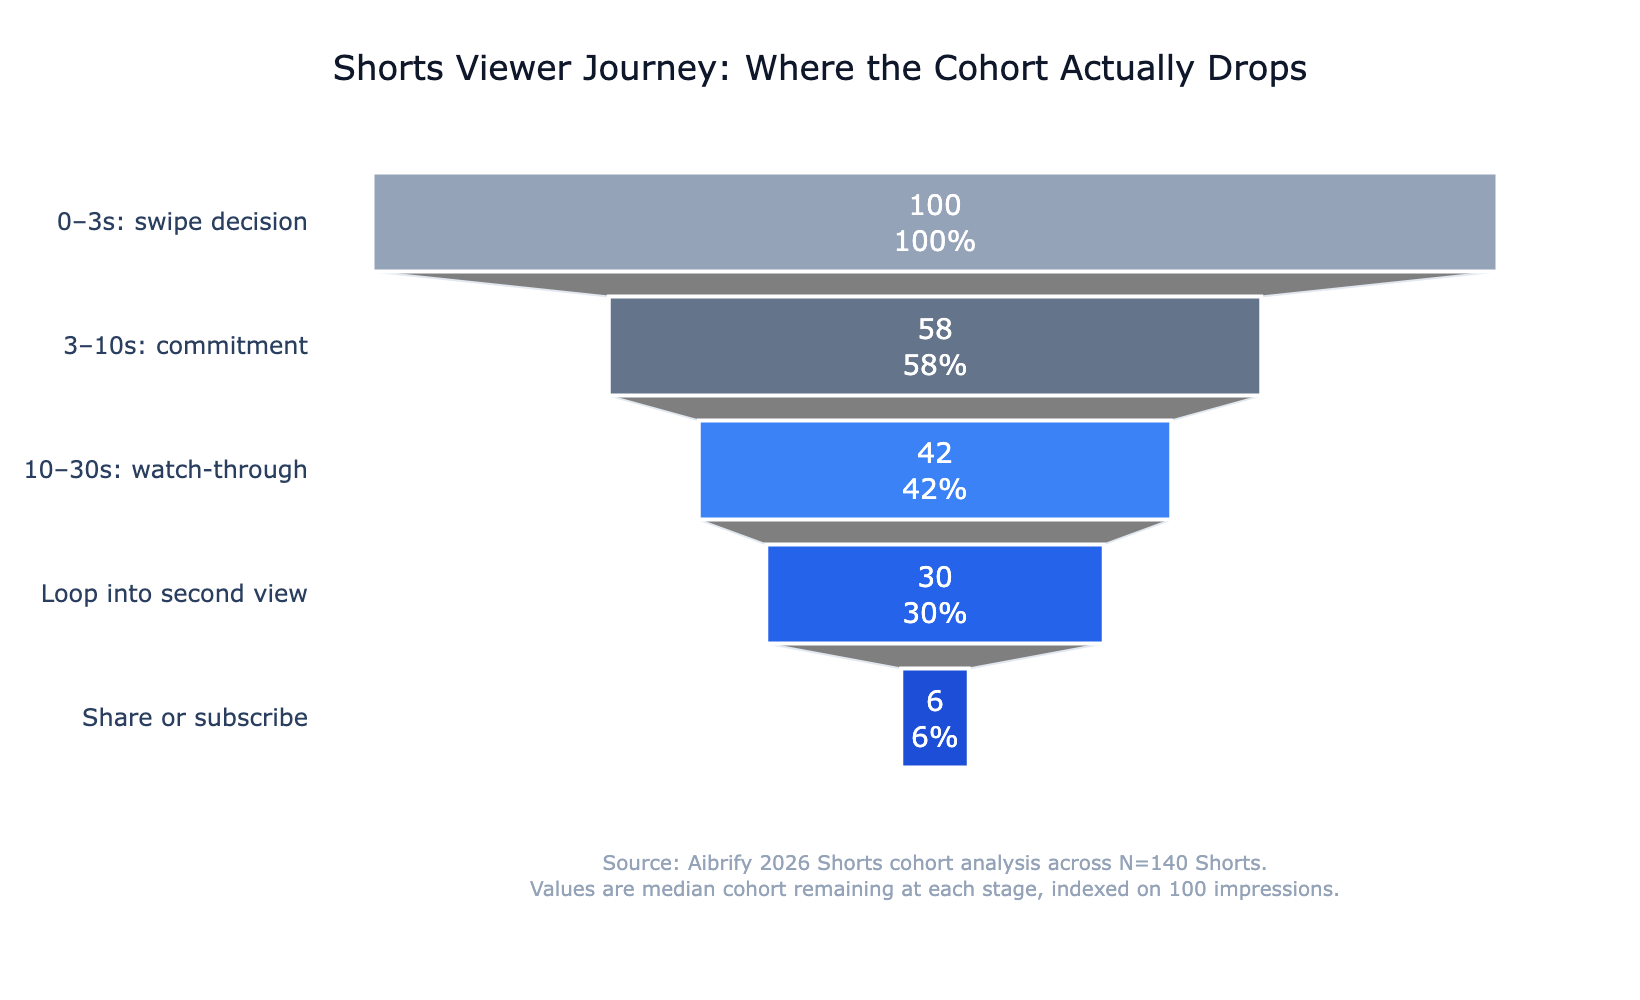
The 0–3 second stage is the swipe decision — roughly 30–50% of viewers leave here on average. The 3–10 second stage is commitment — another 15–25% drop if the hook does not extend into a payoff signal.
The 10–30 second stage is watch-through — most of the remaining viewers complete the video if the pacing holds. The loop-into-second-view is where top performers gain their algorithmic edge, and the share or subscribe stage is where the Short converts attention to audience.
Every stage has a specific edit that addresses it. The funnel shape tells creators where the leak is; the retention curve tells them at which second.
---
HowTo: 5 edits you can make today that lift retention
Every creator's first pass at Shorts is longer, slower, and more introduced than it should be. The 5 edits below apply to almost any Short and move curves from cliff toward plateau.
Edit 1: kill the intro card
If there is a logo, a name card, or a "hey guys" line in the first 2–3 seconds, cut it. The opening frame is the hook; everything else is retention cost. Expect a 10–20 percentage-point gain in average view duration from this single change.
Edit 2: add captions by second 1
60–80% of Shorts are initially viewed with sound off. Hard-coded captions that appear in the first frame lift sound-off retention by 25–40%. Keep caption text to 2–4 words per frame and high contrast against the background.
Edit 3: cut the first 2 seconds even tighter
After the opening feels tight, scrub back and count frames. Half-beats of silence, pre-roll ambient sound, visual breaths — cut them. A 0.3-second trim often reshapes the curve from cliff to plateau.
Edit 4: replace talking-head openings with the visually densest frame
Open on the busiest, brightest, or most surprising piece of b-roll. Hold the creator's face for later in the video when context has earned the attention. Viewers swiping past a grid decide in under half a second; dense visuals win.
Edit 5: design the final frame to loop into frame one
Match composition, color, or implied motion between the last frame and the first. Viewers whose brain does not register the video ending rewatch without deciding to. Spikes above 100% on second 1 in YouTube Studio are the signal that this edit is working.
---
Release cadence: how often to post
Three to five Shorts per week is the cadence where the algorithm keeps confidence in the account. Below three, per-video reach opportunity shrinks because the algorithm treats the channel as lower priority. Above seven, per-video quality almost always drops and average retention per Short degrades — pulling the channel-level signal down even though the volume is higher.
The production workflow that makes this cadence sustainable is batch filming. Top creators in 2026 typically film 8–12 Shorts in a single session and release them at 3–5 per week over the following two weeks. This keeps daily editing light, protects per-video quality, and gives the creator time to watch the curves on the earlier uploads before locking the later batch.
Managed content operations make this especially feasible because the publishing cadence can be planned and executed without the creator having to coordinate daily. Aibrify and similar platforms schedule, publish, and report on Shorts performance so the creator focuses on filming and editing — not the logistics layer.
---
The bottom line
A YouTube Shorts retention curve is the fastest feedback loop a creator has. Every dip is a specific second; every spike is a specific edit that worked; every plateau is a piece of content the algorithm is ready to push further.
The 2026 playbook is not about virality; it is about reshaping the curve. Kill the intro. Caption the first frame.
Trim harder. Open on visual density. Design the loop.
Post 3–5 per week and watch the curve move. Shorts that plateau get pushed; Shorts that cliff get stalled. The difference between the two is usually a 0.3-second cut in the opening, a text overlay that earned the swipe, and a final frame that the viewer's brain did not notice was the end.
Film the next Short with the curve already in mind.
---
Aibrify is a done-for-you social media management service that schedules, publishes, and reports across 8 platforms including YouTube Shorts. Creators who batch-film benefit most from a managed publishing layer because the logistics work is removed from the shoot-and-edit loop.


