
Why does my reported ROAS look higher than actual sales?
Because reported ROAS on Meta, TikTok, and other paid social platforms is a measure of what the platform can claim credit for — not what the ad spend truly caused. Three structural forces widen the gap: iOS App Tracking Transparency (ATT) forces heavy modeling on roughly 75% of iOS users per Adjust's 2023 mobile app trends report, default attribution windows include view-through and 7-day click which absorb organic and branded demand, and every platform reports on its own performance — a structural incentive for inflation.
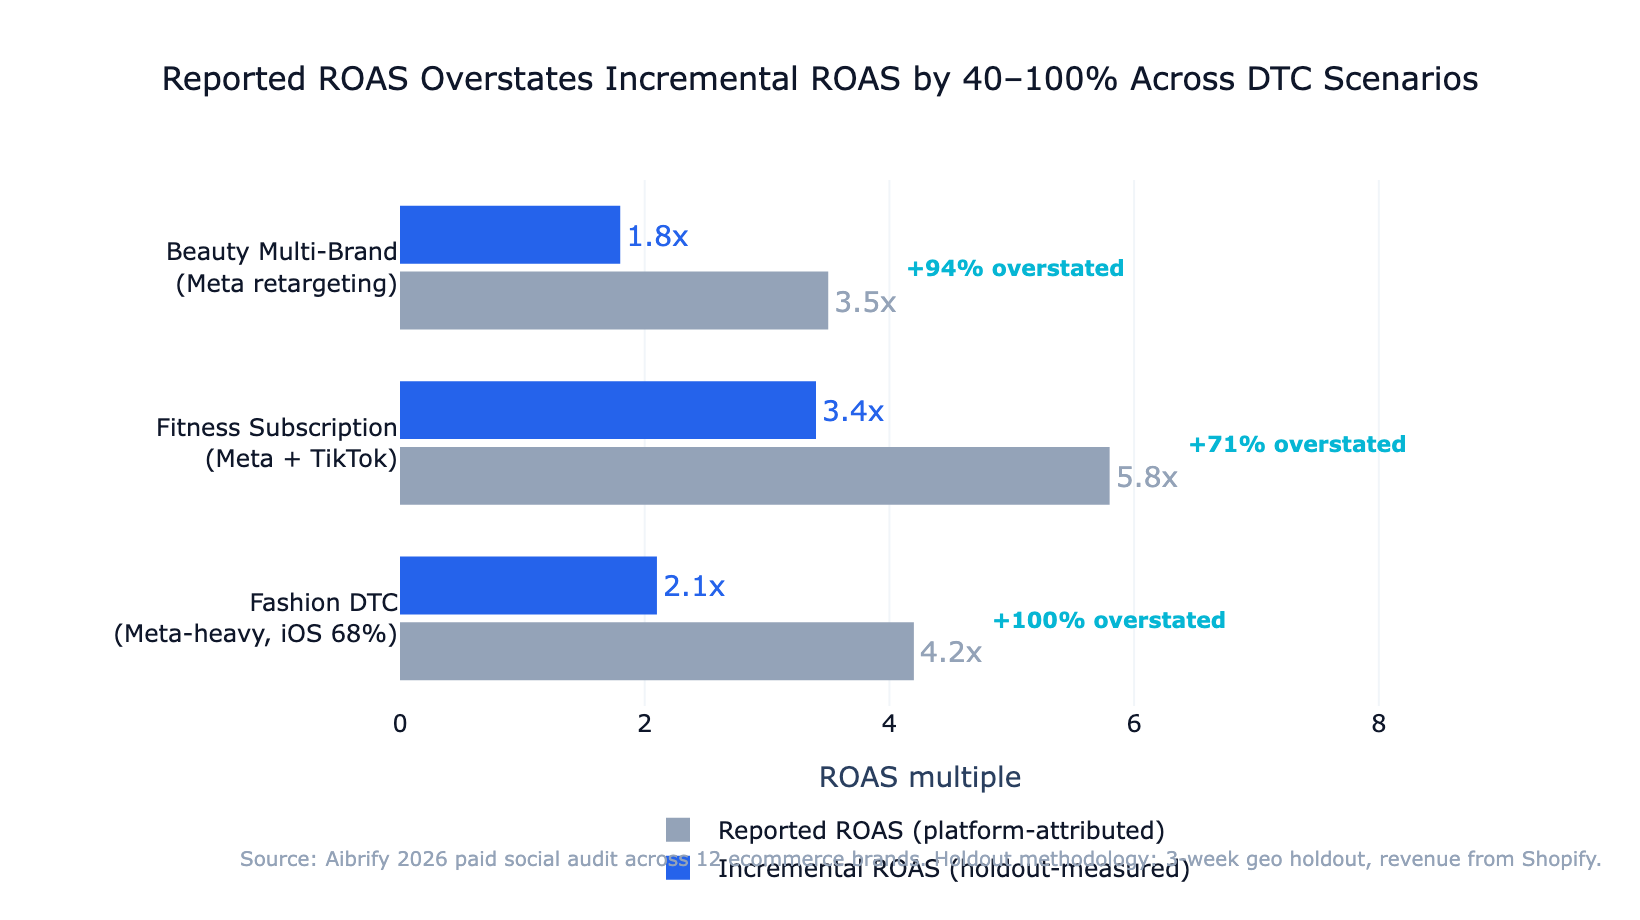
The honest answer for most ecommerce brands: reported ROAS overstates true incremental ROAS by 30–60%. A Meta report showing 4.2x return often translates to roughly 2.1x real lift.
Neither number is wrong — they are measuring different things. The job of a 2026 paid social team is to know the difference and build a reporting layer that exposes it.
This post walks through the three sources of ROAS inflation, how to calculate the incremental number yourself, the four attribution frameworks ranked by cost and accuracy, and a low-cost incrementality test a brand can run without buying any new tools.
---
What is reported ROAS actually measuring?
Reported ROAS is the revenue a platform assigns to its own ads, divided by the spend on those ads. Each platform uses its own pixel or SDK, its own attribution window, and its own logic for handling cross-device or cross-session purchases. A Meta ROAS of 4.2x means Meta's pixel connected $4.20 of purchase revenue to $1.00 of ad spend using Meta's default 7-day-click plus 1-day-view window.
The measurement boundary matters. Meta does not see what a customer did on Google search, or what email touches preceded the ad, or what word-of-mouth brought them to the brand page in the first place. It sees only what its pixel can observe — and the pixel has been progressively blinded since iOS 14.5 arrived in April 2021 per Apple's ATT announcement.
Reported ROAS is still useful. It is a stable within-platform efficiency metric for A/B testing creative, comparing campaigns, and detecting sudden performance drops. It becomes dangerous when it is treated as the source of truth for whether paid social is profitable — because the measurement boundary it lives inside is smaller than the real buyer journey.
---
The 3 sources of ROAS inflation in 2026
Source 1: iOS App Tracking Transparency signal loss
Apple's ATT prompt appeared in iOS 14.5 in April 2021. Global opt-in rates stabilized around 25% per AppsFlyer's 2023 The State of App Marketing report, meaning roughly 75% of iOS ad exposures are no longer observable at the user level by third-party platforms.
Meta and TikTok fill the gap with probabilistic models — aggregated event measurement, SKAdNetwork postbacks, and conversion modeling based on patterns from opted-in users. This is the right engineering response to the constraint, but it widens the gap between observed and modeled attribution.
For U.S. direct-to-consumer ecommerce brands where iOS is typically 60–70% of traffic per Statcounter's mobile OS share data, modeled conversions dominate iOS performance reports.
Meta disclosed the scale of impact on its Q2 2022 earnings call, estimating iOS changes would cost the business roughly $10 billion in 2022 revenue — a rough proxy for how much measurement accuracy the platform lost, not just advertiser spend.
Source 2: Last-click attribution + long view-through windows
Meta's default attribution window is 7-day-click plus 1-day-view. This means any purchase within 7 days of an ad click — or within 24 hours of simply seeing the ad — is credited to Meta.
View-through attribution is the less honest of the two. A user scrolls past a retargeting ad for a brand they already know, never clicks, then buys through a branded search the next day. Meta counts the purchase as attributed even though the user's decision was formed before the ad exposure.
Reducing the window to 7-day-click only (disabling view-through for reporting) typically cuts Meta's reported revenue by 15–25% per brand benchmarks, without actually changing any business outcome.
Last-click attribution — used by most store-native reports including Shopify — has the opposite bias. It credits the last touchpoint before purchase, which is often email or direct traffic, and ignores the paid social ad that drove awareness three weeks earlier. Both systems are wrong in opposing directions; the truth lives between them.
Source 3: Platform self-reporting incentive
Every major ad platform scores its own effectiveness using its own definition. Meta's Ads Manager reports Meta-attributed revenue; TikTok's dashboard reports TikTok-attributed revenue.
A brand running both sees the same purchase counted twice, once in each dashboard.
This is not a conspiracy — it is a structural outcome of platforms needing measurement to justify ad budgets. The practical effect for a brand running 3+ paid channels is that the sum of platform-reported revenue can exceed actual company revenue by 20–40%. If the sum of your Meta, TikTok, and Google Ads attributed revenue is 110% of your Shopify total, one or more platforms is over-counting — and usually all of them are.
---
How to calculate true incremental ROAS
Incremental ROAS has a clean definition:
Incremental ROAS = (Revenue with ads − Revenue without ads) / Ad spend
The challenge is measuring "revenue without ads" for the same market, at the same time. There are three practical methods.
Method 1 — Geographic holdout. Run paid social normally in one comparable market and pause it in another for 2–4 weeks. Compare store-attributed revenue between the two markets, adjusted for baseline ratio. The revenue gap is the incremental lift. This method costs nothing beyond the ad spend opportunity in the holdout market and produces directionally accurate incremental ROAS within a 70–85% confidence band.
Method 2 — Audience holdout via platform-native ghost bidding. Meta's Conversion Lift tool holds out a randomized subset of the targeted audience from seeing ads. The comparison group's conversion rate against the treatment group's gives a platform-validated lift number. The tool is free but requires a minimum spend threshold, and it still uses platform-attributed conversions so it shares some of the underlying measurement bias.
Method 3 — Marketing Mix Modeling (MMM). Statistical regression on 12+ months of aggregate data — media spend by channel, price, seasonality, promotions, macro factors — estimates each channel's contribution to revenue. MMM does not require user-level tracking at all, which makes it structurally immune to iOS ATT signal loss. Google released Meridian as open-source in 2024 and Meta's Robyn has been open-source since 2020, bringing MMM into reach for brands that previously could not afford $50K–$200K vendor contracts.
For most brands under $5M annual ad spend, Method 1 run quarterly delivers enough accuracy to make channel budget decisions. Above that threshold, MMM becomes the honest baseline.
---
4 attribution frameworks ranked by cost and accuracy
The four frameworks available in 2026 trade off differently on implementation cost, data requirements, and accuracy. The table below summarizes the choice space; the chart after it plots the same data visually.
| Framework | Implementation cost | Data requirement | Accuracy | Time to first result | |---|---|---|---|---| | Last-click (default) | Free | Pixel / UTM | 25–50% overstatement | Immediate | | Multi-Touch Attribution (MTA) | $500–$5K/mo vendor | Cross-channel tracking | 15–30% overstatement | 2–4 weeks | | Geo holdout testing | $0 (opportunity cost only) | Store revenue by region | ±10–15% | 2–4 weeks | | Marketing Mix Modeling (MMM) | $0–$200K/yr (open source → vendor) | 12+ months aggregate | ±5–10% | 3–6 months |
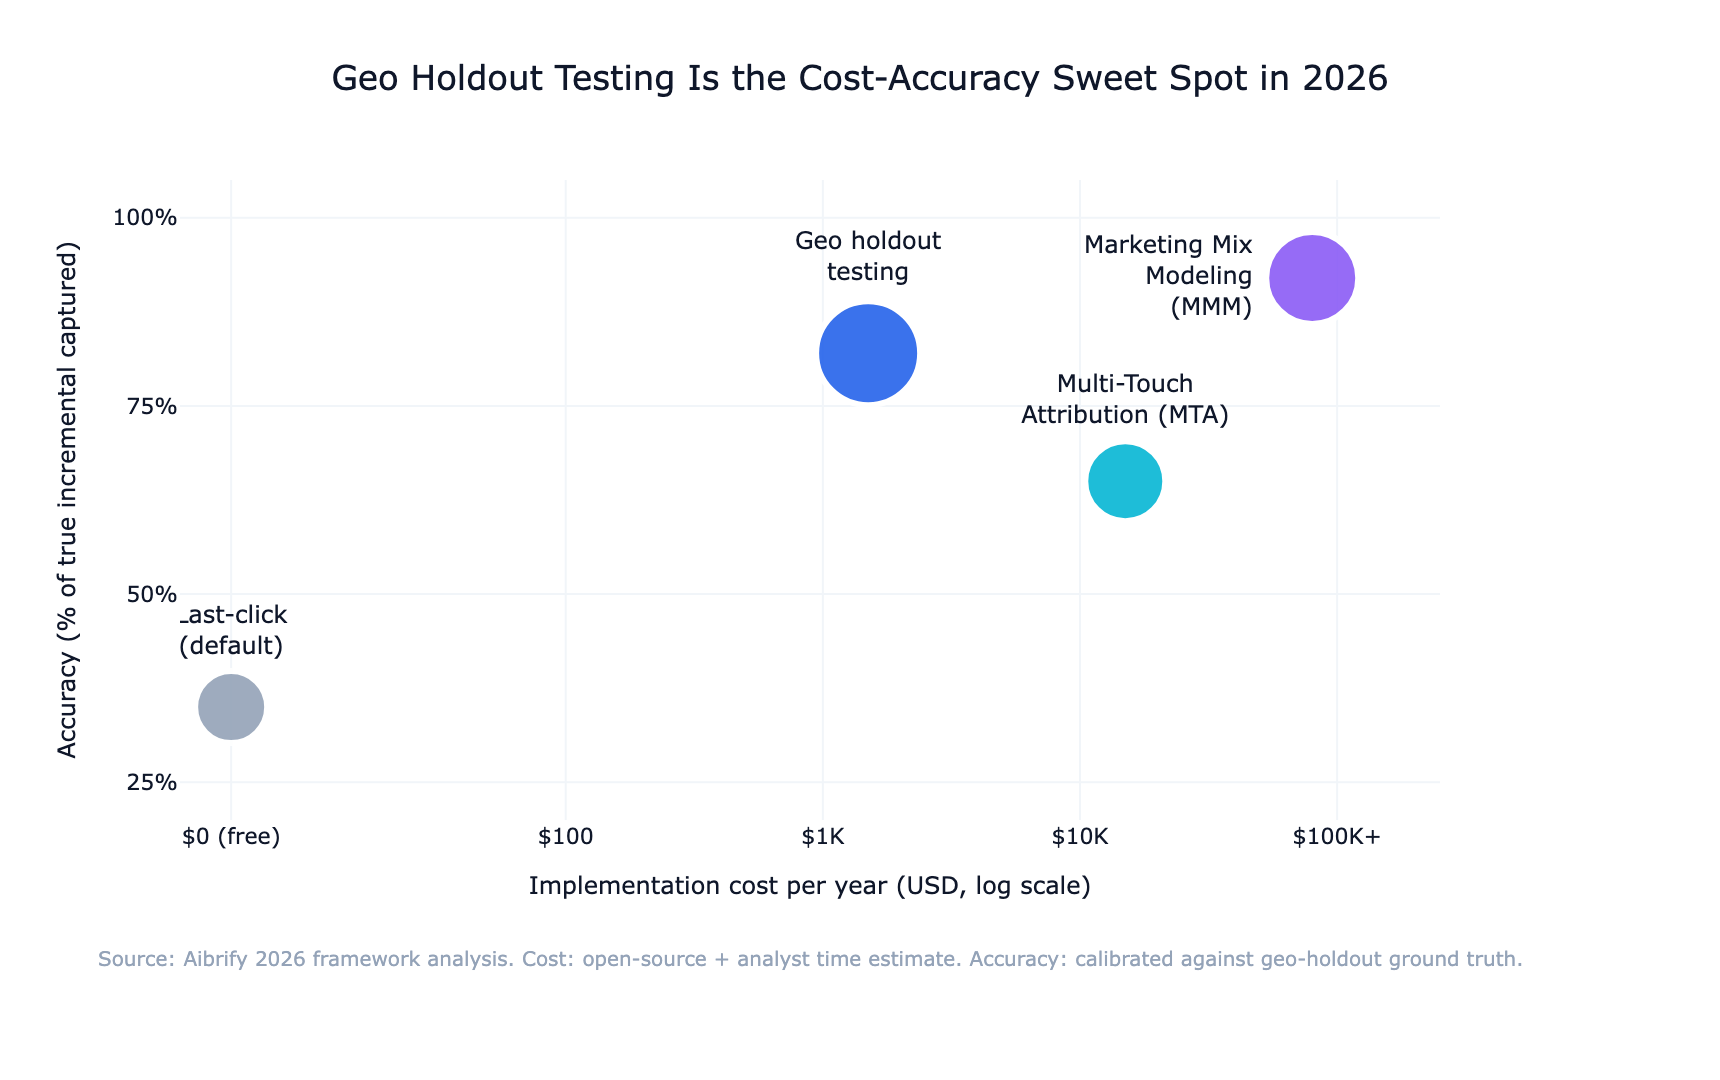
The pragmatic 2026 stack: Geo holdout testing quarterly for within-channel incrementality, combined with store-native reconciliation monthly. MMM layered on top for brands with the data and spend to support it. Multi-Touch Attribution vendors remain useful for agencies managing multiple clients at scale but offer limited marginal value for single-brand teams who have access to open-source MMM.
Last-click on its own is still what most paid social teams report to their CFO. It is not wrong; it is incomplete. The additional cost of running one of the other three methods is small relative to the budget at stake.
---
How to run a low-cost incrementality test
A geographic holdout costs nothing beyond the opportunity cost of the paused market's ad spend. The six steps below are the entire procedure.
Step 1: pick two comparable markets
Two U.S. metros similar on population, income distribution, baseline organic traffic, and historical paid social spend — Phoenix vs Denver, Austin vs Nashville, Portland vs Minneapolis.
Validate by pulling 30 days of Shopify revenue for each market — baseline gap over 20% means pick different markets or apply matched weighting.
Step 2: set the test window and confidence target
80% confidence on a 15% lift detection typically needs 2–3 weeks at $10K–$50K per-market monthly spend. Below $10K monthly, extend to 4 weeks. Avoid major holiday windows or planned promotions that would create noise.
Step 3: pause paid social in the holdout market, keep everything else running
Complete pause on paid social only. Email, SMS, organic social, Google search, display — all continue normally. Run the same promotions in both markets.
Document any anomalies daily: outages, unplanned promotions, PR events, weather shocks.
Step 4: measure lift from store data, not platform reports
Daily revenue from Shopify (or your native store) for both markets. Compute lift as: (test market revenue − holdout market revenue × baseline ratio) over the test window. Divide by the test market's ad spend to get incremental ROAS.
Do not use the platform's attribution report for the lift numerator — the platform cannot see the holdout market's counterfactual behavior.
Step 5: reconcile quarterly with store and email attribution
Once per quarter, lay Meta-attributed revenue, Shopify native-attributed revenue, and Klaviyo email-attributed revenue side by side for the same window. Meta typically reports 1.5–2.5x Shopify's paid social attribution, and 20–35% of Meta-attributed purchases also appear in Klaviyo flows. The reconciliation is not about picking a winner; it is about knowing which report answers which question.
Step 6: build a one-page CFO narrative
Four numbers on one screen: total paid social spend, reported ROAS (Meta default), incremental ROAS (from the holdout), and net-new revenue. A one-page narrative protects the paid social budget in the next planning cycle because the incremental number sits directly next to the reported one with a methodology footnote. Full reports stay in the analyst's folder.
---
How to reconcile Meta with Shopify and Klaviyo
A standing monthly reconciliation is the cheapest single discipline a paid social team can adopt. It takes 30–60 minutes with three data pulls.
Pull Meta-attributed revenue from Ads Manager for the month, filtered to 7-day-click only. Pull Shopify's paid-social-attributed revenue from the Sales by Referrer report. Pull Klaviyo's email-attributed revenue from the Flows report.
Place the three numbers in a table. Industry benchmark: Meta's number is typically 1.5–2.5x Shopify's paid-social number, and Klaviyo will claim 20–35% of Meta-attributed purchases.
The value of the table is not in deciding which number is right — it is in preventing the conversation where a VP asks "why is our ad spend going up but revenue is flat?" with only one data source. A reconciliation surfaces the structural overlaps before they become a credibility problem. The paid social team who runs this monthly is the team whose budget survives the next cost-cutting review.
---
When to graduate from MTA to MMM
Three triggers signal the shift.
Trigger 1 — Monthly paid media spend consistently above $500K across three or more channels. Cross-channel interaction effects (email + paid social, Google + paid social, TV + paid social) start to matter more than within-channel incrementality. MMM handles these interactions natively; MTA approximates them with decay functions that often fit poorly.
Trigger 2 — Meaningful seasonality or promotional cycles. MMM uses time-series baselines that separate promotional lift from baseline demand cleanly. Short holdouts struggle to isolate this because the test window is usually smaller than the seasonal cycle.
Trigger 3 — Analyst capacity on staff. MMM output is a set of regression coefficients with confidence intervals. An organization without someone to interpret overfit risk, multicollinearity, and baseline drift will over-trust the output. Open-source Meridian and Robyn reduce cost to near zero but do not reduce the need for statistical literacy.
Below those triggers, quarterly geo holdouts plus monthly store reconciliation deliver directionally correct channel allocation decisions at effectively zero cost. Brands that cross the triggers typically need 3–6 months of model development before MMM results are trustworthy — plan the transition, do not expect instant insight.
---
What tools work in 2026 (brief)
The attribution tool landscape in 2026 has a clearer shape than it did two years ago.
Open-source MMM. Google's Meridian (2024) and Meta's Robyn (2020) are both production-grade Python libraries. Implementation still requires a data analyst with SQL and Python fluency, but the license cost is zero. These are the right choice for brands spending $500K+/month in paid media with in-house analytics.
MTA / incrementality vendors. Measured, Haus, and Northbeam remain credible for brands that need a managed measurement layer. Vendor costs typically sit in the $5K–$30K/month range depending on data volume. The marginal value over open-source MMM + geo holdouts is the workflow layer — dashboards, alerting, stakeholder reporting — not deeper measurement accuracy.
Store-native attribution. Shopify's native attribution was substantially rewritten in 2024 and now handles cross-device journeys better than it did. It is free, increasingly accurate for ecommerce, and a reasonable default source of truth for total-company revenue attribution when reconciled against platform reports.
Platform-native lift studies. Meta's Conversion Lift and TikTok's Brand Lift are free, provide platform-validated incrementality, but only cover within-platform effects. Useful alongside the frameworks above, not a substitute.
The stack most ecommerce brands should run in 2026: Shopify native attribution as company-wide source of truth, 7-day-click-only Meta reporting for within-channel efficiency, quarterly geo holdouts for incremental truth, and open-source MMM for brands that have crossed the triggers above.
---
The bottom line
Reported ROAS on paid social platforms is not wrong — it is partial. The 30–60% gap between reported and incremental ROAS is the structural cost of measuring within platform boundaries that do not see the full buyer journey.
The fix in 2026 does not require enterprise budgets. A quarterly geographic holdout, a monthly reconciliation with store and email attribution, and a disciplined switch to 7-day-click reporting cover most of the accuracy gap for brands under $5M annual ad spend. Brands above that threshold add open-source MMM — Google's Meridian or Meta's Robyn — to handle cross-channel interaction effects at the scale where they start to matter.
The paid social team that knows the difference between reported and incremental ROAS — and builds a single-page narrative that exposes both to the CFO — is the team whose budget survives the next planning cycle. Measurement discipline is the competitive moat that platform dashboards cannot copy.
Start with one geo holdout this quarter. The method is free; the data is cleaner than any platform report; the result changes how the next budget conversation goes.
---
Aibrify is a done-for-you social media management service that handles content creation, scheduling, publishing, and reporting across 8 platforms. Accurate attribution matters even more when the creative pipeline is running at scale — the structured source data from a managed publishing operation is what makes a geo holdout clean to analyze.


